Many companies recognize the need to reduce their environmental impact and are working hard to achieve this. While some are doing the work to decarbonize their direct operations with more efficient buildings, purchasing renewable energy, or generating on-site, an often overlooked aspect that also needs attention is the supply chain. Depending on the industry, the emissions from a company’s supply chain can be many times greater than their actual operations. According to MIT Supply Chain, if we continue shipping goods as we do today, freight emissions will surpass energy as the most carbon-intensive sector by 2050.
As your logistics partner, Expeditors can help you both calculate your supply chain emissions and take steps to reduce your impact through our new CO2e interactive dashboard and adjacent Supply Chain Solutions services.
Calculating and reporting carbon emissions is a complex, multi-faceted process. Companies working to take on the challenge of accurately calculating and reporting their carbon footprints need to consider both their direct and indirect emissions, referred to as Scope 1, Scope 2, and Scope 3.
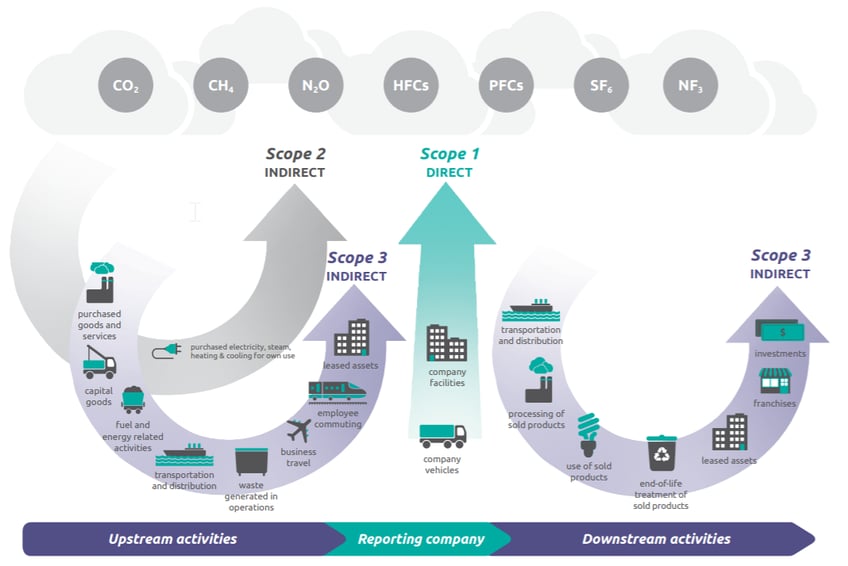
Source: GHG Protocol
Our new dashboard visualizes your Scope 3 transportation emissions facilitated by Expeditors. The dashboard, built using PowerBI and utilizing the GLEC Framework for Emissions Reporting, shines light on the different sources of your emissions.
You can view your emissions over time, by shipping lane, and by commodity description. Examining your environmental impact through each of these lenses can help your company pinpoint hotspots, develop a strategy for reduction, and set you on a path towards a cleaner, more efficient supply chain.
To understand the impact of your supply chain on your emissions, it’s crucial to understand that not all modes of transport are created equally, in terms of environmental impact, time, and cost. For example, a study by MIT found that on average, an airplane emits 47 times as much CO2 as an ocean container vessel per ton-mile. That means that for every ton of goods (2000 lbs) that is transported one mile, the emissions are 47 times more for an airplane than an ocean vessel. (There are many more variables involved, including routing, type of aircraft, load factor, etc. This is just an average factor in the study.)
Diving into your emissions dashboard can reveal surprising insights. As depicted in the video, one company we recently worked with found that although air freight only accounted for 10% of their shipment volume with Expeditors, it represented nearly 90% of their carbon emissions. Upon further investigation, they found that this particular part was quite heavy and was sitting in storage after transport. Products from this particular vendor had always been moved by air, so the company did not question the shipping mode.
After this customer analyzed their lead time and shipping options with our input, they were able to make a mode switch from air to ocean. This change resulted in not only reducing their storage costs but also reducing transportation costs and emissions while still meeting their supply chain needs. While it’s not always this simple, this is a great example of the type of insight our new dashboard can provide.
The dashboard also can provide information CO2e per trade lane, allowing customers to target high-intensity lanes. Targeting emissions using this approach allows customers to then look at specific vendors and service providers, opening the door to further reduction strategies. One customer recently took this approach and found that shipments from Norfolk to Mumbai had nearly double the average CO2e per shipment than their other lanes. With the help of our Supply Chain Solutions team and our Account Management team, we were able to offer lower carbon options for this trade lane and are actively working on additional lanes.
The dashboard can also help open conversations within your company, especially between the sustainability practitioners and the supply chain team. Using this tool can help ensure both departments are meeting their goals.
Using the CO2e Dashboard is a great first step towards understanding your logistics emissions. Our trained professionals can use the insight gleaned from this data, along with your company’s specific needs, to suggest further improvements to your supply chain. Some of the areas that we typically explore include packaging optimizations, supply chain design (and redesign), and mode shifting. Expeditors also offers a variety of options for moving cargo quickly with reduced carbon emissions, such as express ocean and rail services. Read more in our recent blog, Fast Solutions for Getting Cargo Out of China.
The new CO2e dashboard is available to all Expeditors customers through your account management team. We are excited to introduce this tool to our customers in pursuit of reaching our shared goals of environmental sustainability.